gnuplot の dashtype や linecolor などは terminal によって異なっていたりするので、自分用メモとして terminal tikz の場合のサンプルを作ってみました。
gnuplot 5.0 から dashtype が独立に指定できるようになりました。linetype は「linecolor, linewidth, dashtype, pointtype の組み合わせ」となり、ユーザが自由に定義できます。例えば:
# 新しいラインスタイル 1 を、線幅 2, 青色, 点種 6 と定義
set linetype 1 lw 2 lc rgb "blue" pointtype 6
詳しくはマニュアル (あるいは 日本語マニュアル) を参照して下さい。
以下、図はクリックすると大きくなります。linecolor 等は 0 から始めていますが、おそらく 1 以上が正しい値です。
gnuplot Version 5.2 patchlevel 8
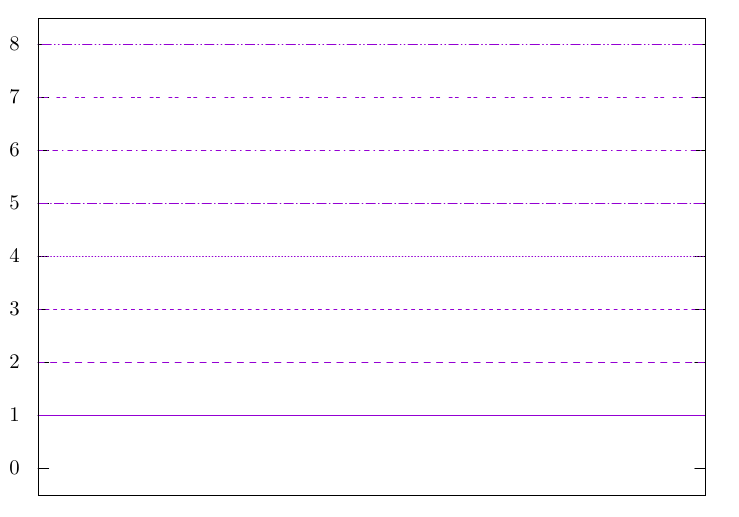
dashtype (linecolor = 1)
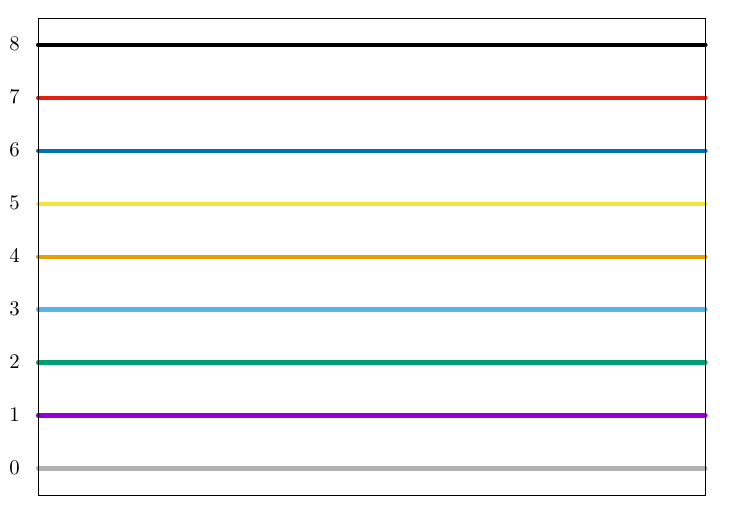
linecolor (linewidth 5)
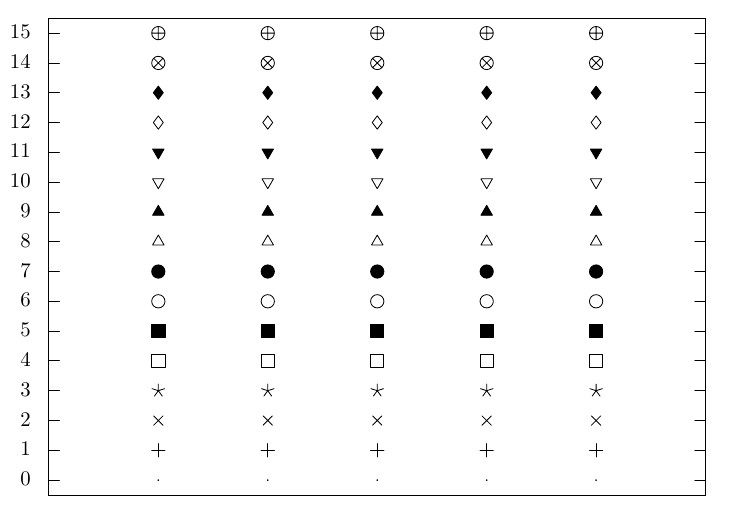
pointtype (pointsize = 2, linecolor = “black”)
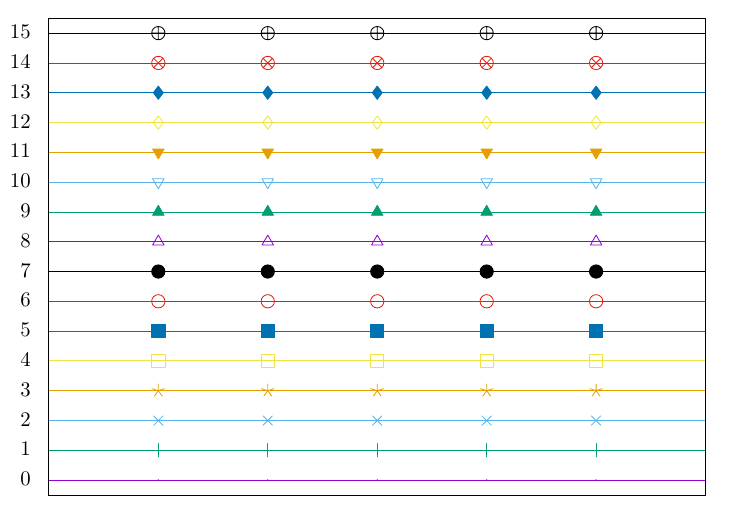
pointtype (with linespoints, pointsize = 2)
参考までにソースも載せておきます:
set terminal tikz standalone

array A[5] = [0, 0, 0, 0, 0]

unset xtics
set ytics 1

set output "1-dashtype.tex"
plot [0:10] [-.5:8.5] for [i=1:8] i notitle dashtype i linecolor 1

set output "2-linecolor.tex"
plot [0:10] [-.5:8.5] for [i=0:8] i notitle linecolor i linewidth 5

set output "3-pointtype.tex"
plot [0:6] [-.5:15.5] for [i=0:15] A using 1:($2+i) notitle pointtype i pointsize 2 linecolor "black"

set output "4-pointtype2.tex"
plot [0:6] [-.5:15.5] for [i=0:15] A using 1:($2+i) notitle pointtype i pointsize 2 with points, for [i=0:15] i notitle