今さら人から聞かれない(誰も覚えてないから)アレの組みかた
これは TeX & LaTeX Advent Calendar 2015 の記事ではありません。
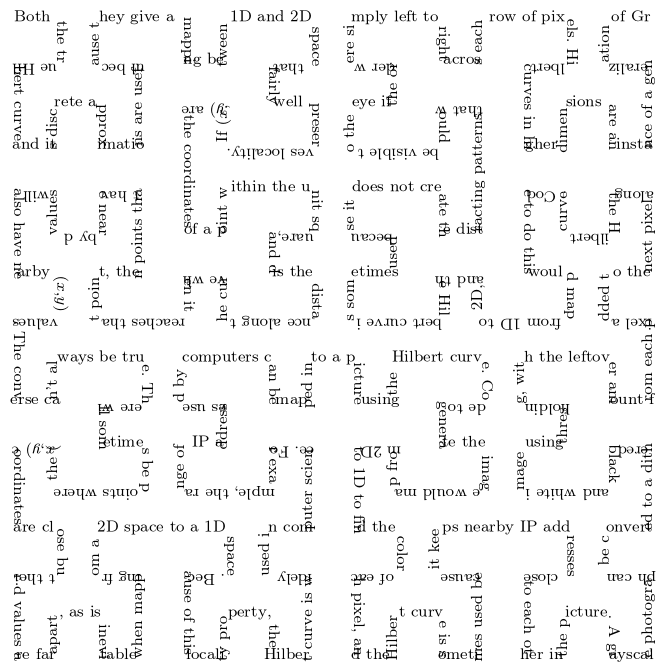
今年 (2015年) の一月ころに、何故か牛耕式組版とやらが流行っているのを見て、フラクタル図形に沿って組版したら面白いんじゃね、 と思ってしまい、以下のようなものを作りました。
流行(?)に乗ってみる。TikZ すげー。角で文字が重なってるとか突っこんじゃダメ😉 テキストは Wikipedia (en) の Hilbert curve より。
– Mad Chemiker (
@_MadChemiker_) January 24, 2015
このときは、コピー&ペーストとトライ&エラーを重ねてどうにか動いたものの、とても他人に見せられるようなソースじゃなかったので、 参考にしたページだけ紹介してお茶を濁しました。
その後、結局何も改善はしていないのですが、せっかくなので改めて紹介することにします。 やっぱり TikZ をきちんと理解してないので、つっこみどころは多いと思います (指摘歓迎)。
最初に「ヒルベルト曲線に沿って組版する」のを思いついたときには割と簡単にできるものだと思っていました。 というもの path に沿って文字を配置する、というのは PostScript では定番中の定番なネタだからです。 しかし TikZ をきちんと理解してない私には、そんなに簡単ではありませんでした。
まぁそれはさておき、順番に見ていきましょう。
Path を作って文字を配置してみる
TikZ のマニュアルに色々例がありますので、それをベースにしつつ書いてみましょう。 というか、ほぼマニュアルからのコピペですが。こんな感じになります。
\documentclass[12pt]{article}

\usepackage{tikz}
\usetikzlibrary{decorations.text}

\begin{document}

% ------------------------------------------------------------
\begin{tikzpicture}
  \fill [draw=none,fill=none,
  postaction={decorate,decoration={raise=2pt,text along path,
      text=around and around and around and around we go foo bar baz
}}]
  (0,1) arc (180:-180:1.5cm and 1cm);
\end{tikzpicture}

\vspace{2cm}

% ------------------------------------------------------------
\begin{tikzpicture}[decoration={text along path,
      text={Some long text along a ridiculously long curve that}}]
   \draw [decorate] (0,0) -- (3,1) arc (0:180:1.5 and 1);
\end{tikzpicture}

\end{document}
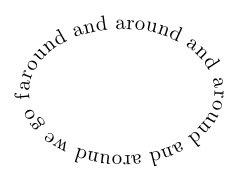
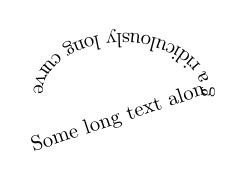
あら、すごくラクチン。
ちなみに螺旋状に組むのは
http://tex.stackexchange.com/questions/88751/text-spirals-with-tikz
とかにあります。
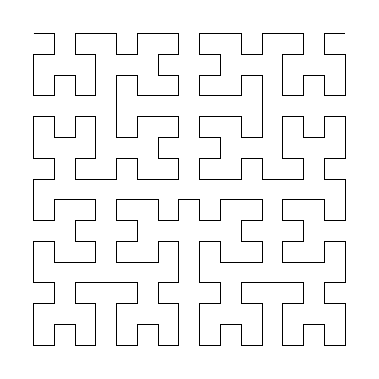
ヒルベルト曲線を TikZ で描く
これはぐぐったらあっさりでてきます:
http://www.texample.net/tikz/examples/hilbert-curve/(Author: Marc van Dongen)
最初のツイートのものはこれを パクった 利用してかいたものです。
が、別のことを調べるために TikZ のマニュアルを見てたら、 ふと “Lindenmayer systems″ という文字列が目に入ってきてしまいました… えええええぇ…
\documentclass{article}

\usepackage{tikz}
\usetikzlibrary{lindenmayersystems}

\begin{document}

% taken from pgfmanual.pdf
\pgfdeclarelindenmayersystem{Hilbert curve}{
  \symbol{X}{\pgflsystemdrawforward}
  \symbol{+}{\pgflsystemturnright}
  \symbol{-}{\pgflsystemturnleft}
  \rule{A -> +BX-AXA-XB+}
  \rule{B -> -AX+BXB+XA-}
}
\tikz\draw[scale=2,lindenmayer system={Hilbert curve, axiom=A, order=4, angle=90}]
lindenmayer system;

\end{document}
合体
さて、ここまできたら両者を合わせるだけです。
\documentclass[12pt]{article}
\usepackage{tikz}
\usetikzlibrary{decorations.text}
\usetikzlibrary{lindenmayersystems}
% from http://en.wikipedia.org/wiki/Hilbert_curve
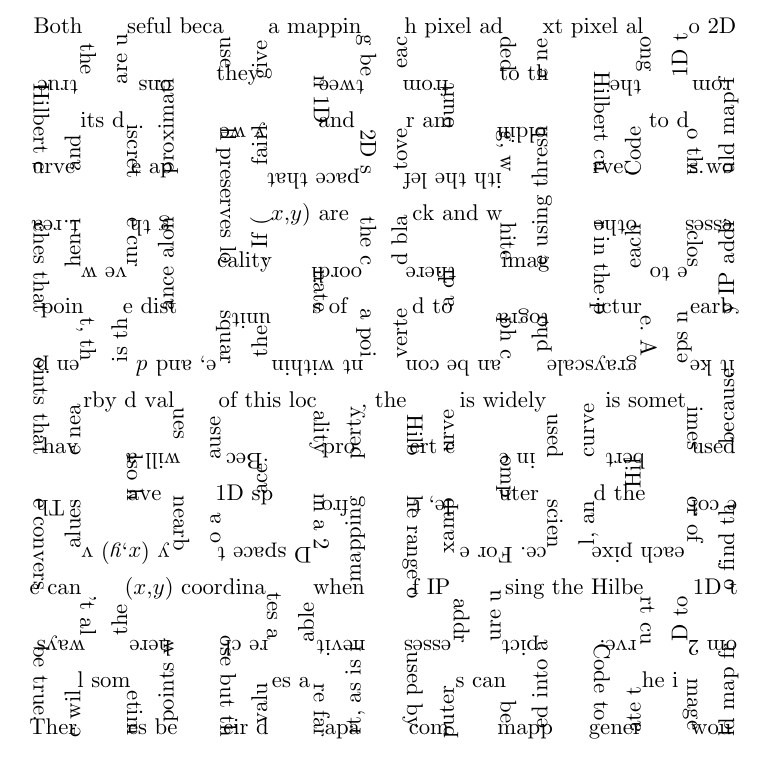
\def\hiltext{%
Both the true Hilbert curve and its discrete approximations are
useful because they give a mapping between 1D and 2D space that
fairly well preserves locality. If $(x,y)$ are the coordinates of a
point within the unit square, and $d$ is the distance along the
curve when it reaches that point, then points that have nearby d
values will also have nearby $(x,y)$ values. The converse can't
always be true. There will sometimes be points where the $(x,y)$
coordinates are close but their $d$ values are far apart, as is
inevitable when mapping from a 2D space to a 1D space. Because of
this locality property, the Hilbert curve is widely used in computer
science. For example, the range of IP addresses used by computers
can be mapped into a picture using the Hilbert curve. Code to
generate the image would map from 2D to 1D to find the color of each
pixel, and the Hilbert curve is sometimes used because it keeps
nearby IP addresses close to each other in the picture. A grayscale
photograph can be converted to a dithered black and white image
using thresholding, with the leftover amount from each pixel added
to the next pixel along the Hilbert curve. Code to do this would map
from 1D to 2D, and the Hilbert curve is sometimes used because it
does not create the distracting patterns that would be visible to
the eye if the order were simply left to right across each row of
pixels. Hilbert curves in higher dimensions are an instance of a
generalization of Gray codes, and are sometimes used for similar
purposes, for similar reasons. For multidimensional databases,
Hilbert order has been proposed to be used instead of Z order
because it has better locality-preserving behavior. For example,
Hilbert curves have been used to compress and accelerate R-tree
indexes (see Hilbert R-tree). They have also been used to help
compress data warehouses.}
\begin{document}
\pgfdeclarelindenmayersystem{Hilbert curve}{
\symbol{X}{\pgflsystemdrawforward}
\symbol{+}{\pgflsystemturnright} % Explicitly define + and - symbols.
\symbol{-}{\pgflsystemturnleft}
\rule{A -> +BX-AXA-XB+}
\rule{B -> -AX+BXB+XA-}
}
\small
\tikz\draw[scale=4.5,%
lindenmayer system={Hilbert curve, axiom=A, order=4, angle=90},
decorate,decoration={text along path, text=\hiltext}]
lindenmayer system;
\end{document}
あら、すごく簡単。
改善
さて、言うまでもなく、角で文字が重なっているのが最大の問題点です。マニュアルを見てたら、また変なものを見つけてしまいました。あああああぁ…
が、これ、Lindenmayer systems ではうまくいかないっぽい (たぶん) ので、Marc van Dongen 氏の方を使ってみます。
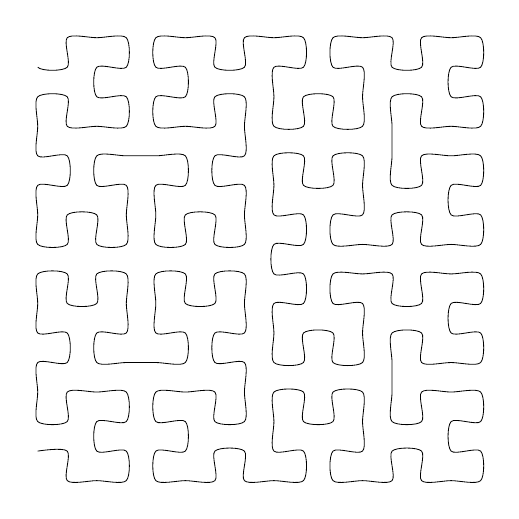
まずは文字なしで。
\documentclass[12pt]{article}

\usepackage{tikz}
\usetikzlibrary{plothandlers}

% ------------------------------------------------------------
% Hilbert-Curve
% from http://www.texample.net/tikz/examples/hilbert-curve/
% (by Marc van Dongen)
%
\usepackage{ifthen}

\newdimen\HilbertLastX
\newdimen\HilbertLastY
\newcounter{HilbertOrder}

\def\DrawToNext#1#2{%
   \advance \HilbertLastX by #1
   \advance \HilbertLastY by #2
%   \pgfpathlineto{\pgfqpoint{\HilbertLastX}{\HilbertLastY}}
   \pgfplotstreampoint{\pgfqpoint{\HilbertLastX}{\HilbertLastY}}
}

% \Hilbert[right_x,right_y,left_x,left_x,up_x,up_y,down_x,down_y]
\def\Hilbert[#1,#2,#3,#4,#5,#6,#7,#8] {
  \ifnum\value{HilbertOrder} > 0%
     \addtocounter{HilbertOrder}{-1}
     \Hilbert[#5,#6,#7,#8,#1,#2,#3,#4]
     \DrawToNext {#1} {#2}
     \Hilbert[#1,#2,#3,#4,#5,#6,#7,#8]
     \DrawToNext {#5} {#6}
     \Hilbert[#1,#2,#3,#4,#5,#6,#7,#8]
     \DrawToNext {#3} {#4}
     \Hilbert[#7,#8,#5,#6,#3,#4,#1,#2]
     \addtocounter{HilbertOrder}{1}
  \fi
}
% ------------------------------------------------------------

\begin{document}

\tikz [scale=8] {
  \pgfplothandlercurveto
  \pgfplotstreamstart
  \pgfpathmoveto{\pgfqpoint{\HilbertLastX}{\HilbertLastY}};
  \setcounter{HilbertOrder}{4}
  \Hilbert[1.25mm,0mm,-1.25mm,0mm,0mm,1.25mm,0mm,-1.25mm]
  \pgfusepath{stroke}
}

\end{document}
あ、これ、いけるんじゃね? と思ったのですが、4 次のヒルベルト曲線で文字を配置しようとすると、
Dimension too large.と言われてダメでした。3 次ならいけました。
\documentclass[12pt]{article}

\usepackage{tikz}
\usetikzlibrary{decorations.text}
\usetikzlibrary{plothandlers}

% ------------------------------------------------------------
% Hilbert-Curve
% from http://www.texample.net/tikz/examples/hilbert-curve/
% (by Marc van Dongen)
%
\usepackage{ifthen}

\newdimen\HilbertLastX
\newdimen\HilbertLastY
\newcounter{HilbertOrder}

\def\DrawToNext#1#2{%
   \advance \HilbertLastX by #1
   \advance \HilbertLastY by #2
%   \pgfpathlineto{\pgfqpoint{\HilbertLastX}{\HilbertLastY}}
   \pgfplotstreampoint{\pgfqpoint{\HilbertLastX}{\HilbertLastY}}
}

% \Hilbert[right_x,right_y,left_x,left_x,up_x,up_y,down_x,down_y]
\def\Hilbert[#1,#2,#3,#4,#5,#6,#7,#8] {
  \ifnum\value{HilbertOrder} > 0%
     \addtocounter{HilbertOrder}{-1}
     \Hilbert[#5,#6,#7,#8,#1,#2,#3,#4]
     \DrawToNext {#1} {#2}
     \Hilbert[#1,#2,#3,#4,#5,#6,#7,#8]
     \DrawToNext {#5} {#6}
     \Hilbert[#1,#2,#3,#4,#5,#6,#7,#8]
     \DrawToNext {#3} {#4}
     \Hilbert[#7,#8,#5,#6,#3,#4,#1,#2]
     \addtocounter{HilbertOrder}{1}
  \fi
}
% ------------------------------------------------------------

% from http://en.wikipedia.org/wiki/Hilbert_curve
\def\hiltext{%
  (上と同じなので省略)
}

\begin{document}

\scriptsize
\tikz [scale=8] {
  \pgfplothandlercurveto
  \pgfplotstreamstart
  \pgfpathmoveto{\pgfqpoint{\HilbertLastX}{\HilbertLastY}};
  \setcounter{HilbertOrder}{3}
  \Hilbert[1.25mm,0mm,-1.25mm,0mm,0mm,1.25mm,0mm,-1.25mm]
  \fill [decorate,decoration={text along path, text=\hiltext}]
  % \pgfusepath{stroke}
}

\end{document}
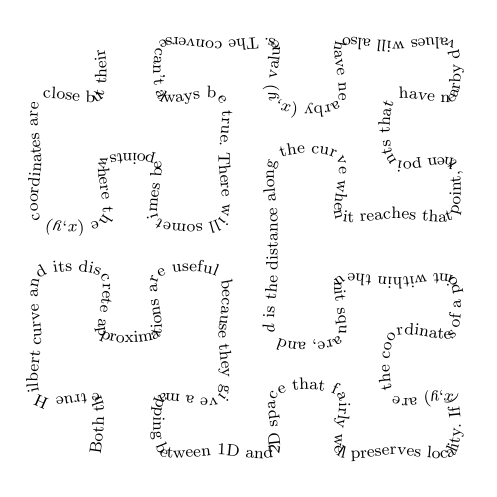
まだ重なってますが、これ以上追求してもアレなので、まぁいいでしょう。
あ、今気付きましたが、最初と最後が切れてますね…